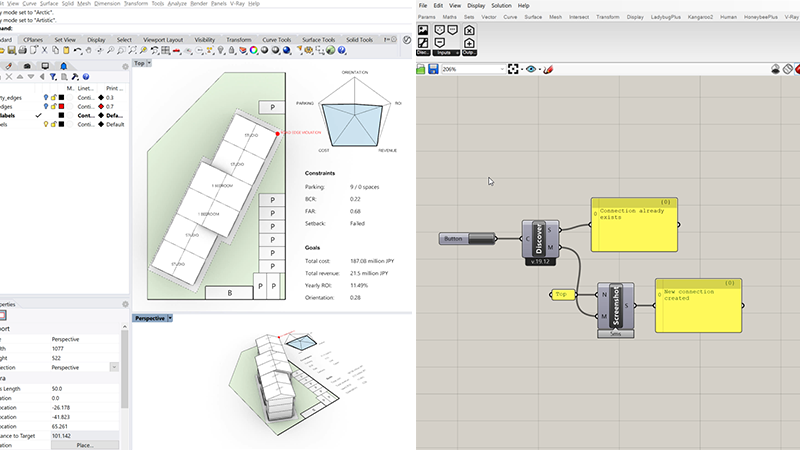
Connect your existing design models
Discover is designed to connect seamlessly to your Grasshopper models, with minimal
overhead required for taking an existing model and setting it up for optimization. A small
set of components handle connecting your model to the Discover server, and specifying the
inputs and outputs passed between your model and Discover. Meanwhile, all optimization and
visualization tasks are handled in an external, web-based platform.
Generate input parameters
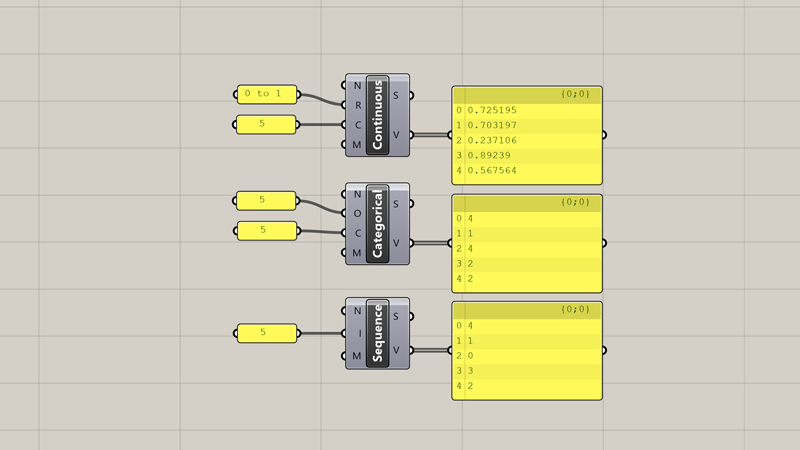
Discover supports a range of input parameter types to drive your generative models. This
includes Continuous parameters for variables that vary continuously,
Categorical
parameters for values that take on one of several defined options, and a special
Sequence parameter which defines a unique ordering of a set of items.
Define objectives and constraints
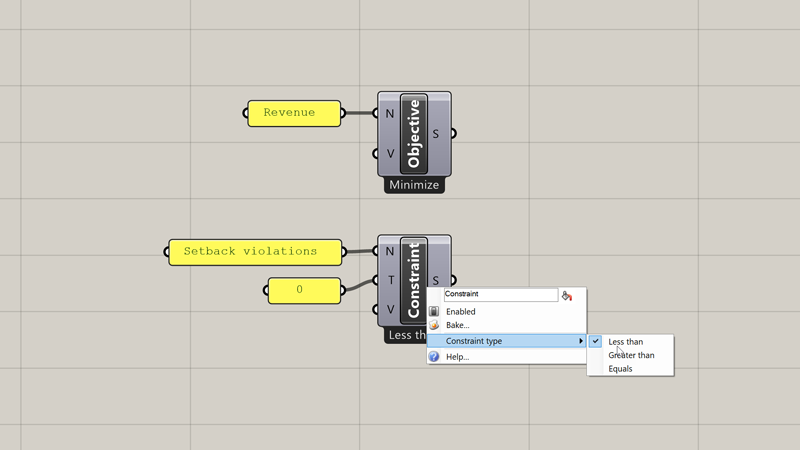
Discover supports both single and multi-objective optimization workflows, and has full
support for constraint handling. Objectives and constraints can be easily defined by
connecting output values from your models into a special set of Objective
and Constraint
components. Context menus within the components allow you to select the type of objective (minimize
or maximize), or the type of constraint (less than, greater than, or exactly matching a specified
value) you want to use.
Run optimizations
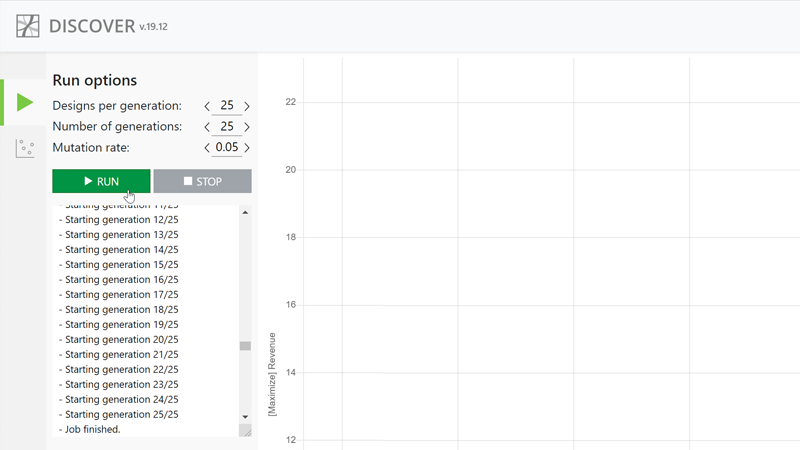
Once you've specified the inputs, objectives, and constraints you wish you use in your
model, you can use Discover's web-based interface to run optimization jobs. The Run Options panel
allows you to specify the parameters of your optimization job, including the number of designs
to create in each generation, the number of generations to produce, and the mutation rate to
use when generating new designs.
Reveal complex trade-offs
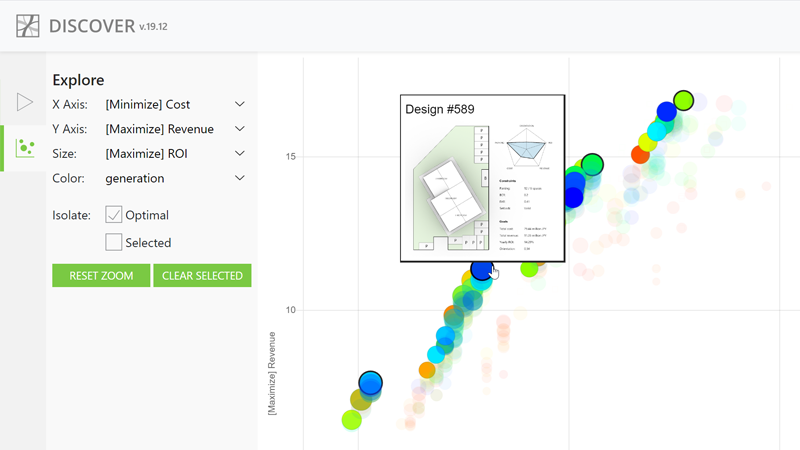
Discover's visualization interface is based around a 4-d scatter plot which you can use to
monitor an ongoing optimization or to evaluate the results of a previously run
optimization. Each valid design is displayed as a circle, while designs that violate one
or more constraints are displayed as hollow squares. The Explore panel allows
you to map any objective value to the four dimensions of the scatter plot (x-coordinate, y-coordinate,
circle size and color). You can also visualize the design or generation number to evaluate
optimization trends over time.
Explore a wide space of design
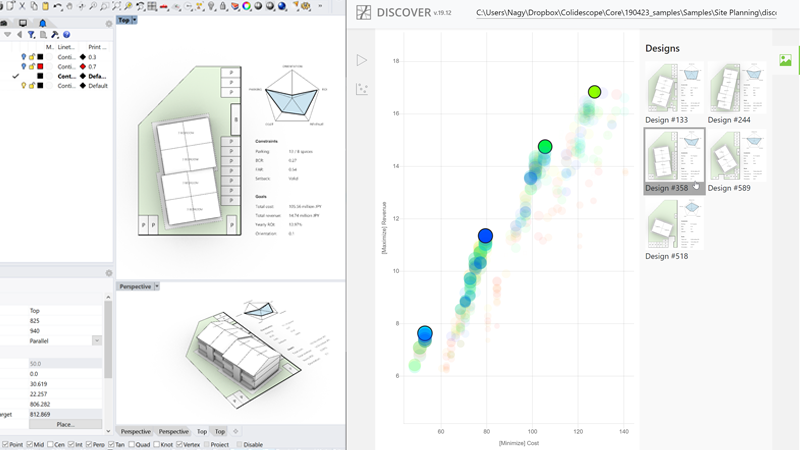
Discover supports a bi-directional data flow with your Rhino Grasshopper model. Once an
optimization is run, you can use the scatter plot to explore the set of designs in your
design space, filter to show only the best-performing designs, and select a set of designs
for further analysis. Clicking on any design in the Designs panel will automatically
regenerate it in your Grasshopper model so you can proceed with the rest of your design workflow.